
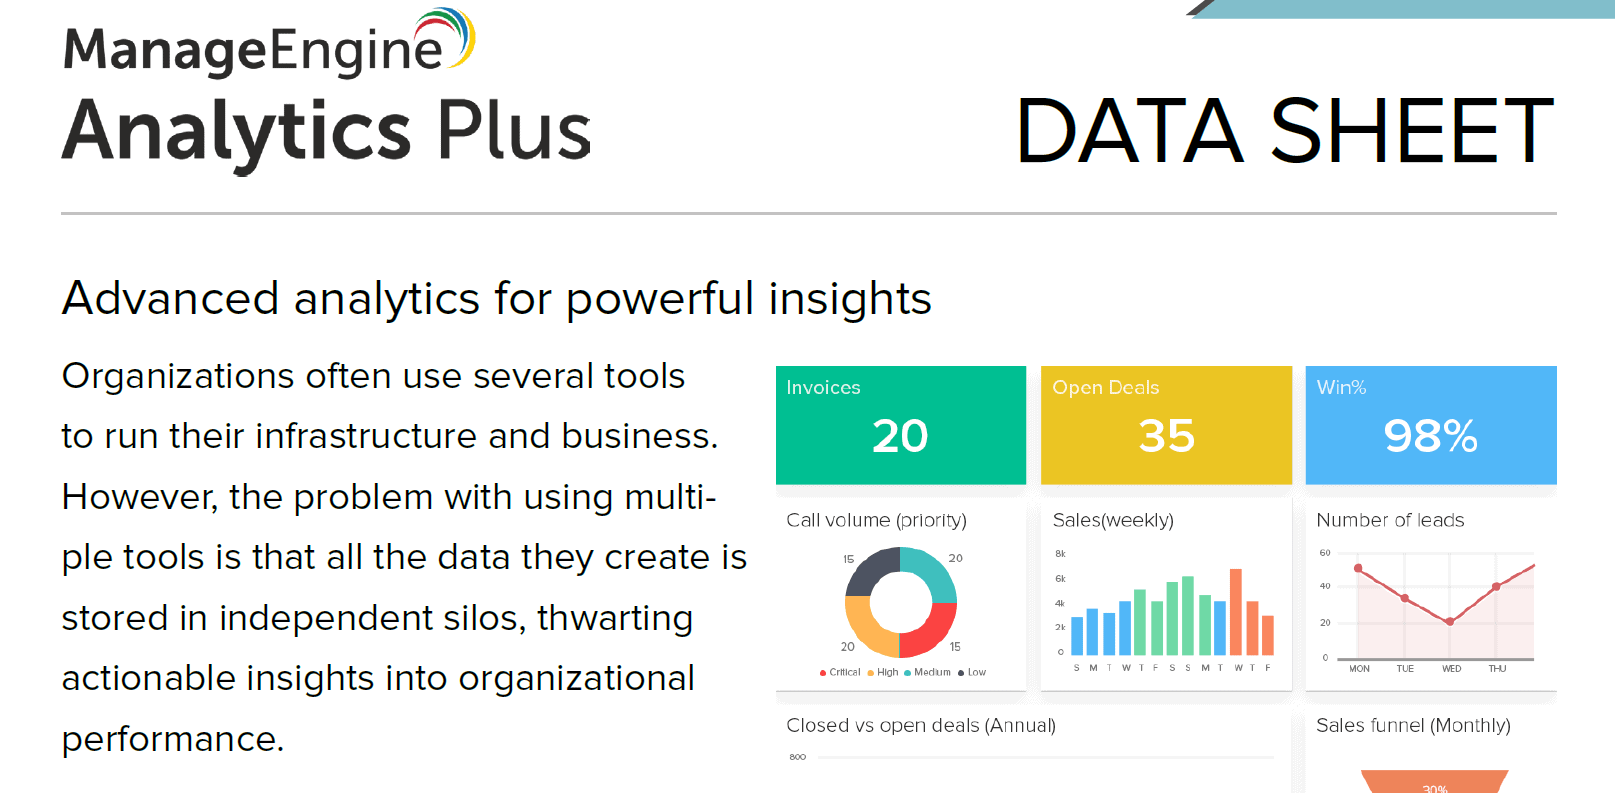
Comprehensive analysis solution for better insights into your IT
ManageEngine Analytics Plus is a self-service advanced analytics solution which provides users a unified view of their IT, using interactive reports and dashboards. Get a unified view of your IT by integrating with ManageEngine's ITSM, ITOM and Customer Support suite, Analytics Plus.
Analytics Plus also pulls in data from other data sources including files, feeds, databases and more, and transforms it into rich visualizations. Users can create and customize reports on an intuitive drag and drop visual interface. With preconfigured KPIs, role based dashboards, prebuilt reports, user filters and different types of visualizations, Analytics Plus allows users to slice and dice data easily. Users can securely share and collaborate with their team to reach a consensus quickly.
What You Can Expect
Why Analytics Plus?
Advantages
Analytics Plus Benefits
")
Highlight Features
Out-of-the-box Integrations for your IT applications

ServiceDesk Plus
Get a better overview of your ITSM data and thus improve the performance and efficiency of IT service delivery.
Applications Manager
Monitor application availability and performance in all environments and make strategic decisions based on the monitoring data.

OpManager
Gain powerful insights into your network performance, track down errors, and view alarm trends to improve network availability.


Endpoint Central (Formerly Desktop Central)
Get a complete overview of your endpoints and set up early warning systems for internal and external security threats.


SupportCenter Plus
Improve customer satisfaction and increase support efficiency and performance through extensive analysis functions.

Mobile Device Manager Plus
Analyze audit data from mobile devices and discover security risks faster.

Editions
Analytics Plus is Available in 2 variants
FAQ's
Frequently Asked Questions
What is purpose of Analytics Plus?
ManageEngine Analytics Plus is a business intelligence and analytics solution that helps organizations analyze the business data easily, and create insightful reports and dashboards for informed decision-making. It can be set up in minutes, and it offers more than 150 pre-built reports and dashboards.
What type of reports can be created in Analytics Plus?
Analytics Plus supports a wide variety of report creation options, which includes:
- Charts: This allows creating any chart/graph. C Also supports the Tabular Data view of the graph.
- Pivot Tables: This allows creating a powerful view with data summarized in a grid in horizontal and vertical columns.
- Tabular Views: This allows creating simple table views with column grouping and sub-totals (aggregation).
- Summary View: This allows creating a view with summarized values and grouping.
- Dashboards: This allows creating dashboards consisting of multiple reports in a single page format. Dashboards provide you a quick, at-a-glance view of your key business information for easy analysis and visualization.
Does Analytics Plus support creating dashboards?
Yes, ManageEngine Analytics Plus does support dashboard creation. ManageEngine Analytics Plus provides an easy-to-use drag and drop interface for creating custom dashboards in minutes. Using the dashboard users can display a collection of reports on a single page, providing a quick at-a-glance view of Key Business Information for easy analysis & visualization.
How often will my ServiceNow data sync with Analytics Plus?
After setting up the Analytics Plus account, the users might have to wait 5-10 minutes for the initial data synchronization to complete. Once the initial data synchronization is done, subsequent changes in ServiceNow will be synchronized with Analytics Plus every hour.
How do I start and stop the Analytics Plus application?
For Windows installations, users can start and stop your ManageEngine Analytics Plus application from the Services window. For Linux installations, use the start and stop scripts in the bin folder under the Analytics Plus installation.
How do I install Analytics Plus?
Being the Swiss Partner of ManageEngine, Kidan is responsible for aiding with professional services, such as installing, implementing, configuring, training, and supporting the company to ensure an effective on-boarding of Analytics Plus.
To make it even better, Kidan even provides advice on top of it all!
Get in touch with us to know more.
Want to continue the
conversation?
Thank you for your interest in ManageEngine's Analytics Plus solution. Please fill out the form below to ask a question or request assistance.
Features Analytics Plus
Power Up Your IT Using Analytics Plus

Augmented analytics
Using artificial intelligence, machine learning, and natural language processing, Zia understands user questions and provides instant responses in the form of insightful reports and dashboards.

Out-of-the-box integrations
Get a third eye view into your systems, applications, networks, and operations with out-of-the-box integrations. Make better, faster decisions with real-time data and analysis.

Visual analysis
From simple pie charts to heat maps and geo charts, create engaging visualizations that reveal hidden insights on your data. Interact with your visuals, and drill deeper into trends, anomalies, and outliers.

Predictive analysis
With Analytics Plus' predictive capabilities, you can easily determine whether you need to increase or decrease your IT budget in line with expected changes in resource and asset requirements.

Data Blending
Perform cross-functional analytics by combining data from IT operations, help desks, endpoint management apps, and more.
Sharing and collaboration
Share performance updates, tag other users, and alert them of exposed security vulnerabilities. Mail reports as PDFs or images, leverage the create slideshare feature, and engage in meaningful conversations with your team—regardless of where they are.

Multi-source Data import
Analytics Plus imports data from a variety of local files, cloud sources, and databases to help you get a unified view of your IT ecosystem.
Advanced analytics features
With the right intel, your team can work wonders! Enable your team to reach back and research historical data for cognitive insights. Empower them to generate instant reports upon import, saving them time and effort.

Analytics on the go
Stay on top of what's happening in your IT department wherever you are. The Analytics Plus app—available for iPad, tablets, and mobile phones—makes it easy to get updates on SLA compliance, key goals, and operational efficiency, even when you're on the move.
FAQ's
Frequently Asked Questions
What is purpose of Analytics Plus?
ManageEngine Analytics Plus is a business intelligence and analytics solution that helps organizations analyze the business data easily, and create insightful reports and dashboards for informed decision-making. It can be set up in minutes, and it offers more than 150 pre-built reports and dashboards.
How often will my ServiceNow data sync with Analytics Plus?
After setting up the Analytics Plus account, the users might have to wait 5-10 minutes for the initial data synchronization to complete. Once the initial data synchronization is done, subsequent changes in ServiceNow will be synchronized with Analytics Plus every hour.
What type of reports can be created in Analytics Plus?
Analytics Plus supports a wide variety of report creation options, which includes:
- Charts: This allows creating any chart/graph. C Also supports the Tabular Data view of the graph.
- Pivot Tables: This allows creating a powerful view with data summarized in a grid in horizontal and vertical columns.
- Tabular Views: This allows creating simple table views with column grouping and sub-totals (aggregation).
- Summary View: This allows creating a view with summarized values and grouping.
- Dashboards: This allows creating dashboards consisting of multiple reports in a single page format. Dashboards provide you a quick, at-a-glance view of your key business information for easy analysis and visualization.
Does Analytics Plus support creating dashboards?
Yes, ManageEngine Analytics Plus does support dashboard creation. ManageEngine Analytics Plus provides an easy-to-use drag and drop interface for creating custom dashboards in minutes. Using the dashboard users can display a collection of reports on a single page, providing a quick at-a-glance view of Key Business Information for easy analysis & visualization.
How do I start and stop the Analytics Plus application?
For Windows installations, users can start and stop your ManageEngine Analytics Plus application from the Services window. For Linux installations, use the start and stop scripts in the bin folder under the Analytics Plus installation.
How do I install Analytics Plus?
Being the Swiss Partner of ManageEngine, Kidan is responsible for aiding with professional services, such as installing, implementing, configuring, training, and supporting the company to ensure an effective on-boarding of Analytics Plus.
To make it even better, Kidan even provides advice on top of it all!
Get in touch with us to know more.
Want to continue the
conversation?
Thank you for your interest in ManageEngine's Analytics Plus solution. Please fill out the form below to ask a question or request assistance.
Analytics Plus Editions Available
FAQ's
Frequently Asked Questions
What is purpose of Analytics Plus?
ManageEngine Analytics Plus is a business intelligence and analytics solution that helps organizations analyze the business data easily, and create insightful reports and dashboards for informed decision-making. It can be set up in minutes, and it offers more than 150 pre-built reports and dashboards.
How often will my ServiceNow data sync with Analytics Plus?
After setting up the Analytics Plus account, the users might have to wait 5-10 minutes for the initial data synchronization to complete. Once the initial data synchronization is done, subsequent changes in ServiceNow will be synchronized with Analytics Plus every hour.
What type of reports can be created in Analytics Plus?
Analytics Plus supports a wide variety of report creation options, which includes:
- Charts: This allows creating any chart/graph. C Also supports the Tabular Data view of the graph.
- Pivot Tables: This allows creating a powerful view with data summarized in a grid in horizontal and vertical columns.
- Tabular Views: This allows creating simple table views with column grouping and sub-totals (aggregation).
- Summary View: This allows creating a view with summarized values and grouping.
- Dashboards: This allows creating dashboards consisting of multiple reports in a single page format. Dashboards provide you a quick, at-a-glance view of your key business information for easy analysis and visualization.
Does Analytics Plus support creating dashboards?
Yes, ManageEngine Analytics Plus does support dashboard creation. ManageEngine Analytics Plus provides an easy-to-use drag and drop interface for creating custom dashboards in minutes. Using the dashboard users can display a collection of reports on a single page, providing a quick at-a-glance view of Key Business Information for easy analysis & visualization.
How do I start and stop the Analytics Plus application?
For Windows installations, users can start and stop your ManageEngine Analytics Plus application from the Services window. For Linux installations, use the start and stop scripts in the bin folder under the Analytics Plus installation.
How do I install Analytics Plus?
Being the Swiss Partner of ManageEngine, Kidan is responsible for aiding with professional services, such as installing, implementing, configuring, training, and supporting the company to ensure an effective on-boarding of Analytics Plus.
To make it even better, Kidan even provides advice on top of it all!
Get in touch with us to know more.
Want to continue the
conversation?
Thank you for your interest in ManageEngine's Analytics Plus solution. Please fill out the form below to ask a question or request assistance.
Analytics Plus Standard Edition
Analytics Plus Professional Edition
FAQ's
Frequently Asked Questions
What is purpose of Analytics Plus?
ManageEngine Analytics Plus is a business intelligence and analytics solution that helps organizations analyze the business data easily, and create insightful reports and dashboards for informed decision-making. It can be set up in minutes, and it offers more than 150 pre-built reports and dashboards.
How often will my ServiceNow data sync with Analytics Plus?
After setting up the Analytics Plus account, the users might have to wait 5-10 minutes for the initial data synchronization to complete. Once the initial data synchronization is done, subsequent changes in ServiceNow will be synchronized with Analytics Plus every hour.
What type of reports can be created in Analytics Plus?
Analytics Plus supports a wide variety of report creation options, which includes:
- Charts: This allows creating any chart/graph. C Also supports the Tabular Data view of the graph.
- Pivot Tables: This allows creating a powerful view with data summarized in a grid in horizontal and vertical columns.
- Tabular Views: This allows creating simple table views with column grouping and sub-totals (aggregation).
- Summary View: This allows creating a view with summarized values and grouping.
- Dashboards: This allows creating dashboards consisting of multiple reports in a single page format. Dashboards provide you a quick, at-a-glance view of your key business information for easy analysis and visualization.
Does Analytics Plus support creating dashboards?
Yes, ManageEngine Analytics Plus does support dashboard creation. ManageEngine Analytics Plus provides an easy-to-use drag and drop interface for creating custom dashboards in minutes. Using the dashboard users can display a collection of reports on a single page, providing a quick at-a-glance view of Key Business Information for easy analysis & visualization.
How do I start and stop the Analytics Plus application?
For Windows installations, users can start and stop your ManageEngine Analytics Plus application from the Services window. For Linux installations, use the start and stop scripts in the bin folder under the Analytics Plus installation.
How do I install Analytics Plus?
Being the Swiss Partner of ManageEngine, Kidan is responsible for aiding with professional services, such as installing, implementing, configuring, training, and supporting the company to ensure an effective on-boarding of Analytics Plus.
To make it even better, Kidan even provides advice on top of it all!
Get in touch with us to know more.
Want to continue the
conversation?
Thank you for your interest in ManageEngine's Analytics Plus solution. Please fill out the form below to ask a question or request assistance.
Analytics Plus Help Document

FAQ's
Frequently Asked Questions
What is purpose of Analytics Plus?
ManageEngine Analytics Plus is a business intelligence and analytics solution that helps organizations analyze the business data easily, and create insightful reports and dashboards for informed decision-making. It can be set up in minutes, and it offers more than 150 pre-built reports and dashboards.
How often will my ServiceNow data sync with Analytics Plus?
After setting up the Analytics Plus account, the users might have to wait 5-10 minutes for the initial data synchronization to complete. Once the initial data synchronization is done, subsequent changes in ServiceNow will be synchronized with Analytics Plus every hour.
What type of reports can be created in Analytics Plus?
Analytics Plus supports a wide variety of report creation options, which includes:
- Charts: This allows creating any chart/graph. C Also supports the Tabular Data view of the graph.
- Pivot Tables: This allows creating a powerful view with data summarized in a grid in horizontal and vertical columns.
- Tabular Views: This allows creating simple table views with column grouping and sub-totals (aggregation).
- Summary View: This allows creating a view with summarized values and grouping.
- Dashboards: This allows creating dashboards consisting of multiple reports in a single page format. Dashboards provide you a quick, at-a-glance view of your key business information for easy analysis and visualization.
Does Analytics Plus support creating dashboards?
Yes, ManageEngine Analytics Plus does support dashboard creation. ManageEngine Analytics Plus provides an easy-to-use drag and drop interface for creating custom dashboards in minutes. Using the dashboard users can display a collection of reports on a single page, providing a quick at-a-glance view of Key Business Information for easy analysis & visualization.
How do I start and stop the Analytics Plus application?
For Windows installations, users can start and stop your ManageEngine Analytics Plus application from the Services window. For Linux installations, use the start and stop scripts in the bin folder under the Analytics Plus installation.
How do I install Analytics Plus?
Being the Swiss Partner of ManageEngine, Kidan is responsible for aiding with professional services, such as installing, implementing, configuring, training, and supporting the company to ensure an effective on-boarding of Analytics Plus.
To make it even better, Kidan even provides advice on top of it all!
Get in touch with us to know more.
Want to continue the
conversation?
Thank you for your interest in ManageEngine's Analytics Plus solution. Please fill out the form below to ask a question or request assistance.
Fill up the form to get a personalized Quote, that best suits your requirements.
How We May Help You ?
Customer Service & Support
We value and believe in the relationships we have with our customers as they represent the most crucial part of our organization.
Kidan provides customer service and support via email. To contact our support teams, please feel free to send us an email to the below addresses:
A telephone hotline is available to our customers to receive immediate support and advise during business hours and days :
Telephone: +41 58 598 60 40
Business days: Monday – Friday
Business hours: 8:00 AM – 5:00 PM (Swiss time)
We also provide a live chat to ensure you get a quick response. You can reach us through our live chat widget on the bottom right of your screen. The availability of our chat support is:
- Monday – Friday
- 8:00 AM to 5:00 PM Swiss Time
FAQ's
Frequently Asked Questions
What is purpose of Analytics Plus?
ManageEngine Analytics Plus is a business intelligence and analytics solution that helps organizations analyze the business data easily, and create insightful reports and dashboards for informed decision-making. It can be set up in minutes, and it offers more than 150 pre-built reports and dashboards.
How often will my ServiceNow data sync with Analytics Plus?
After setting up the Analytics Plus account, the users might have to wait 5-10 minutes for the initial data synchronization to complete. Once the initial data synchronization is done, subsequent changes in ServiceNow will be synchronized with Analytics Plus every hour.
What type of reports can be created in Analytics Plus?
Analytics Plus supports a wide variety of report creation options, which includes:
- Charts: This allows creating any chart/graph. C Also supports the Tabular Data view of the graph.
- Pivot Tables: This allows creating a powerful view with data summarized in a grid in horizontal and vertical columns.
- Tabular Views: This allows creating simple table views with column grouping and sub-totals (aggregation).
- Summary View: This allows creating a view with summarized values and grouping.
- Dashboards: This allows creating dashboards consisting of multiple reports in a single page format. Dashboards provide you a quick, at-a-glance view of your key business information for easy analysis and visualization.
Does Analytics Plus support creating dashboards?
Yes, ManageEngine Analytics Plus does support dashboard creation. ManageEngine Analytics Plus provides an easy-to-use drag and drop interface for creating custom dashboards in minutes. Using the dashboard users can display a collection of reports on a single page, providing a quick at-a-glance view of Key Business Information for easy analysis & visualization.
How do I start and stop the Analytics Plus application?
For Windows installations, users can start and stop your ManageEngine Analytics Plus application from the Services window. For Linux installations, use the start and stop scripts in the bin folder under the Analytics Plus installation.
How do I install Analytics Plus?
Being the Swiss Partner of ManageEngine, Kidan is responsible for aiding with professional services, such as installing, implementing, configuring, training, and supporting the company to ensure an effective on-boarding of Analytics Plus.
To make it even better, Kidan even provides advice on top of it all!
Get in touch with us to know more.
Want to continue the
conversation?
Thank you for your interest in ManageEngine's Analytics Plus solution. Please fill out the form below to ask a question or request assistance.