
Network monitoring and IT infrastructure monitoring
ManageEngine OpManager is software for network, server and virtualization monitoring . IT administrators can use it to monitor the availability and performance of their network efficiently and cost-effectively - thanks to extensive functions such as flow-based bandwidth analysis, log analyzes for firewalls, configuration, IP address and switch port management.
Automated workflows , intelligent alarms (by email, SMS, trap, syslog, etc.), configurable rules and over 100 preconfigured, expandable templates and reports enable IT to set up a 24/7 monitoring system within a few hours. With OpManager, all important network parameters such as availability, speed and utilization can be continuously monitored . In this way, IT teams can often correct malfunctions before the end users even notice the impairment.
OpManager offers comprehensive fault and performance management for servers, virtual servers, services, Microsoft applications and databases, wireless area networks (WAN), VoIP services, network devices, etc. - all via a single web console. The solution is easy to install and intuitive to use . It is therefore a cost-effective alternative to expensive, large and complex network management systems that are currently available on the market.
OpManager is suitable for small, medium-sized and large companies as well as for IT service providers (managed service providers).
What You Can Expect
OpManager is Capable of
Some Perks
Advantages of ADAudit Plus
")
Some Feature
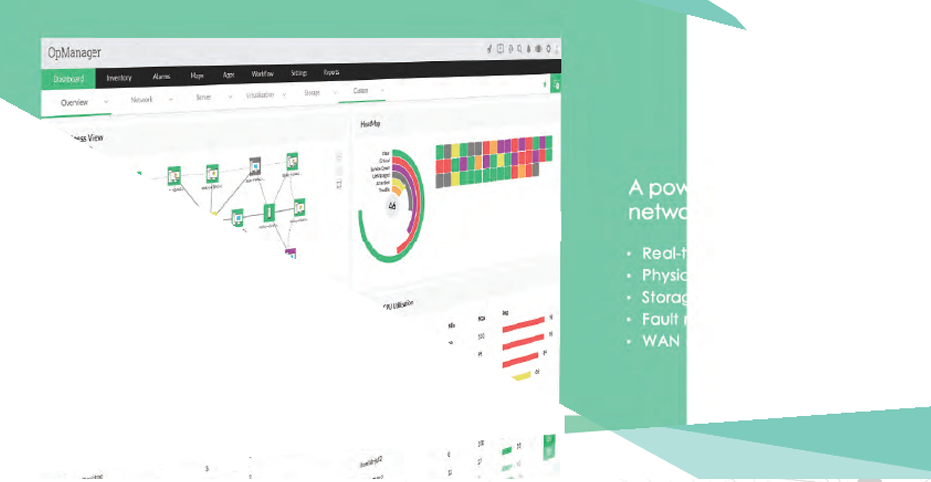
A Glance of OpManager

Real-time network monitoring
With over 2000 built in network performance monitors ,monitor health and critical metrics such as packet loss, latency, speed, errors and discards, and analyze performance bottlenecks.

Customizable dashboards
Assess default dashboards or create your own dashboards by making use of over 200 performance widgets available and view performance of your network at-a-glance.

Physical and virtual server monitoring
Monitor CPU, memory, and disk utilization of Windows and Linux servers. Also monitor the performance of Hosts and VMs of VMware, Hyper-V, Xen and Nutanix server virtualization platforms.

WAN Link monitoring
Monitor key metrics such as latency, jitter, RTT, and packet loss to eliminate network issues. View hop-by-hop performance to find what's causing latency and fix it quickly.

Multi-level thresholds
Proactively monitor network performance with multi-level thresholds. For every critical performance monitor, set multiple thresholds and get instant alerts for violation.

Affordable and easy to set up
ManageEngine OpManager requires no costly consultation or training for installation and user education. It's the only network monitor tool to offer a transparent device-based pricing model.
Editions
Available in Three Editions
FAQ's
Frequently Asked Questions
How does OpManager monitor the devices?
OpManager is an agent-less monitoring and management tool that uses a wide variety of protocols and technologies: ICMP, SNMP, WMI, CLI (Telnet/ SSH), TFTP, SCP. OpManager also includes a Syslog demon, SNMP Trap listener and Flow collectors for NetFlow, sFlow etc. All these and more bring together many network performance monitoring and management capabilities within OpManager.
How many devices can I monitor with OpManager?
The OpManager polling engine can monitor up to 10,000 Interfaces. However, this depends on the system hardware, polling frequency and type of devices. The OpManager Enterprise Edition can monitor up to 50,000 interfaces. To know the exact number of interfaces monitored by your OpManager installation, refer to the “edition” page on the product page.
What are the different types of Personality Identifiable Information in OpManager?
- Email ID
- Name
- Phone Number
- Mac Address
- IP Address
What are the supported datatypes for Performance monitors in OpManager?
The following data types are supported for Performance monitors in OpManager:
- Integer
- Decimal
- String
Why is intermediate/root certificate required when I import the certificate?
The intermediate and root certificates are needed to validate the server certificate provided. The server Certificate along with the intermediate and root certificates forms a complete chain, termed as ‘Chain of trust’, which establishes the authenticity of the certificate.
How do I install OPManager Plus
Being the Swiss Partner of ManageEngine, Kidan is responsible for aiding with professional services, such as installing, implementing, configuring, training, and supporting the company to ensure an effective on-boarding of OP Manager Plus.
To make it even better, Kidan even provides advice on top of it all!
Get in touch with us to know more.
Want to continue the conversation?
Thank you for the interest in ManageEngine's OP Manager solutions. Please fill out the form below to ask a question or request assistance.
Features OpManager
Clear Network Monitoring


VoiP quality & WAN RTT monitoring
Monitor the availability and latency of remote locations as well as VoIP quality


Network monitoring tools
Switch port mapper, ping tool, traceroute tool, MiB browser and other tools

Printer monitoring
Monitor status and utilization, query conditions such as “toner almost empty”, “paper cassette empty”

Cross-Platform Server Monitoring

Windows server monitoring
Monitor typical performance metrics, availability of services and services


Windows, Linux and Unix server monitoring
CPU, RAM, HDD, partitions and network traffic for Unix, Linux, Solaris, AIX and HP-UX

VMware, Microsoft Hyper-V and Citrix Xen monitoring
Long-term performance as well as peaks of the hosts and VMs, top utilization for CPU, memory and network

Active Directory Monitoring
General AD utilization, monitoring of individual services such as Kerberos and role query

File and folder monitoring
Monitoring of files and directories as well as their parameters (e.g. existence, content, changes, size, age)


Windows EventLog Monitoring
Collect and evaluate failed login attempts, access to files and other logs

Monitor processes & services
Notifications of the availability or disappearance of processes and OS services
Network Traffic Analysis

Bandwidth Monitoring
Monitor bandwidth usage in real time and keep an eye on users with high bandwidth requirements

Extended security analyzes (ASAM)
Identify and classify threats and attacks in real time with the Advanced Security Analytics Module (ASAM)

Router traffic monitoring
Continuous, flow-based monitoring of network devices such as routers or switches

Cisco IPSLA monitoring
Monitoring of critical performance indicators such as jitter, latency times, packet loss and RTT for reliable VoiP services and WAN availability
Cisco AVC monitoring
Comprehensive overview of the bandwidth requirements per application, possibility to prioritize business-critical applications

Cisco NBAR reporting
Detection and classification of applications that use dynamic ports with NBAR (Network Based Application Recognition)
Network Configuration Management

Configuration backups
Automatic creation of configuration backups including versioning and storage in an encrypted format

Compliance monitoring
Automatic monitoring of whether specified standards / guidelines are being adhered to and the creation of compliance reports

Comparison of configurations
Compare different configuration versions of a device or different devices directly and identify changes at a glance

Firmware upgrades / OS image transfer
Automate software updates, operating system images or the configuration of banner messages for network devices

Change management
Real-time tracking of configuration changes using the syslog messages from the devices

Switch Port & IP Address Management


Switch port management
Detection of all switches in the network and identification of all devices connected to a switch port
Fault & Performance Management


Alarms
Notification, for example, by e-mail, SMS, trap or syslog when a limit value is exceeded - many alarm messages are predefined according to best practices


Out-of-the-box real-time graphics
Real-time display of key performance indicators - including a query every second for critical situations
Data Center Management


Business Views
Creation of graphical representations of the network for an optimal overview of performance information

Layer 2 network overview
Automated creation of network plans to visualize the network infrastructure
Easy Installation

Discovery Rule Engine
Automatic assignment of performance monitoring views, notification profiles, etc. during the first network scan

Monitoring templates
Preconfigured ``device templates`` with predefined monitoring parameters and intervals for numerous device types

Bulk configuration tool
``Bulk Configuration Tool`` enables changes to be made to several devices at the same time (e.g. application of templates, profiles or login data)

Expand, Adapt & Integrate IT Management Software


REST APIs
With the help of the REST interfaces, help desk and IT management solutions from third-party providers can be integrated into OpManager
FAQ's
Frequently Asked Questions
How does OpManager monitor the devices?
OpManager is an agent-less monitoring and management tool that uses a wide variety of protocols and technologies: ICMP, SNMP, WMI, CLI (Telnet/ SSH), TFTP, SCP. OpManager also includes a Syslog demon, SNMP Trap listener and Flow collectors for NetFlow, sFlow etc. All these and more bring together many network performance monitoring and management capabilities within OpManager.
How many devices can I monitor with OpManager?
The OpManager polling engine can monitor up to 10,000 Interfaces. However, this depends on the system hardware, polling frequency and type of devices. The OpManager Enterprise Edition can monitor up to 50,000 interfaces. To know the exact number of interfaces monitored by your OpManager installation, refer to the “edition” page on the product page.
What are the different types of Personality Identifiable Information in OpManager?
- Email ID
- Name
- Phone Number
- Mac Address
- IP Address
What are the supported datatypes for Performance monitors in OpManager?
The following data types are supported for Performance monitors in OpManager:
- Integer
- Decimal
- String
Why is intermediate/root certificate required when I import the certificate?
The intermediate and root certificates are needed to validate the server certificate provided. The server Certificate along with the intermediate and root certificates forms a complete chain, termed as ‘Chain of trust’, which establishes the authenticity of the certificate.
How do I install OPManager Plus
Being the Swiss Partner of ManageEngine, Kidan is responsible for aiding with professional services, such as installing, implementing, configuring, training, and supporting the company to ensure an effective on-boarding of OP Manager Plus.
To make it even better, Kidan even provides advice on top of it all!
Get in touch with us to know more.
Want to continue the conversation?
Thank you for the interest in ManageEngine's OP Manager solutions. Please fill out the form below to ask a question or request assistance.
Available Editions of OpManager
FAQ's
Frequently Asked Questions
How does OpManager monitor the devices?
OpManager is an agent-less monitoring and management tool that uses a wide variety of protocols and technologies: ICMP, SNMP, WMI, CLI (Telnet/ SSH), TFTP, SCP. OpManager also includes a Syslog demon, SNMP Trap listener and Flow collectors for NetFlow, sFlow etc. All these and more bring together many network performance monitoring and management capabilities within OpManager.
How many devices can I monitor with OpManager?
The OpManager polling engine can monitor up to 10,000 Interfaces. However, this depends on the system hardware, polling frequency and type of devices. The OpManager Enterprise Edition can monitor up to 50,000 interfaces. To know the exact number of interfaces monitored by your OpManager installation, refer to the “edition” page on the product page.
What are the different types of Personality Identifiable Information in OpManager?
- Email ID
- Name
- Phone Number
- Mac Address
- IP Address
What are the supported datatypes for Performance monitors in OpManager?
The following data types are supported for Performance monitors in OpManager:
- Integer
- Decimal
- String
Why is intermediate/root certificate required when I import the certificate?
The intermediate and root certificates are needed to validate the server certificate provided. The server Certificate along with the intermediate and root certificates forms a complete chain, termed as ‘Chain of trust’, which establishes the authenticity of the certificate.
How do I install OPManager Plus
Being the Swiss Partner of ManageEngine, Kidan is responsible for aiding with professional services, such as installing, implementing, configuring, training, and supporting the company to ensure an effective on-boarding of OP Manager Plus.
To make it even better, Kidan even provides advice on top of it all!
Get in touch with us to know more.
Want to continue the conversation?
Thank you for the interest in ManageEngine's OP Manager solutions. Please fill out the form below to ask a question or request assistance.
OpManager Standard Edition
OpManager Professional Edition
OpManager Enterprise Edition
OpManager Add-ons (no download required)
Access Point Monitoring Add-On (Wireless controller based)
URL Monitoring Add-On
OpManager Additional User Pack
NFA Add-On for OpManager
NCM Add-On for OpManager
Firewall Add-On for OpManager
IPAM & SPM Add-On for OpManager
Storage Monitoring Add-on for OpManager
APM Plugin
FAQ's
Frequently Asked Questions
How does OpManager monitor the devices?
OpManager is an agent-less monitoring and management tool that uses a wide variety of protocols and technologies: ICMP, SNMP, WMI, CLI (Telnet/ SSH), TFTP, SCP. OpManager also includes a Syslog demon, SNMP Trap listener and Flow collectors for NetFlow, sFlow etc. All these and more bring together many network performance monitoring and management capabilities within OpManager.
How many devices can I monitor with OpManager?
The OpManager polling engine can monitor up to 10,000 Interfaces. However, this depends on the system hardware, polling frequency and type of devices. The OpManager Enterprise Edition can monitor up to 50,000 interfaces. To know the exact number of interfaces monitored by your OpManager installation, refer to the “edition” page on the product page.
What are the different types of Personality Identifiable Information in OpManager?
- Email ID
- Name
- Phone Number
- Mac Address
- IP Address
What are the supported datatypes for Performance monitors in OpManager?
The following data types are supported for Performance monitors in OpManager:
- Integer
- Decimal
- String
Why is intermediate/root certificate required when I import the certificate?
The intermediate and root certificates are needed to validate the server certificate provided. The server Certificate along with the intermediate and root certificates forms a complete chain, termed as ‘Chain of trust’, which establishes the authenticity of the certificate.
How do I install OPManager Plus
Being the Swiss Partner of ManageEngine, Kidan is responsible for aiding with professional services, such as installing, implementing, configuring, training, and supporting the company to ensure an effective on-boarding of OP Manager Plus.
To make it even better, Kidan even provides advice on top of it all!
Get in touch with us to know more.
Want to continue the conversation?
Thank you for the interest in ManageEngine's OP Manager solutions. Please fill out the form below to ask a question or request assistance.
OpManager Help Document


FAQ's
Frequently Asked Questions
How does OpManager monitor the devices?
OpManager is an agent-less monitoring and management tool that uses a wide variety of protocols and technologies: ICMP, SNMP, WMI, CLI (Telnet/ SSH), TFTP, SCP. OpManager also includes a Syslog demon, SNMP Trap listener and Flow collectors for NetFlow, sFlow etc. All these and more bring together many network performance monitoring and management capabilities within OpManager.
How many devices can I monitor with OpManager?
The OpManager polling engine can monitor up to 10,000 Interfaces. However, this depends on the system hardware, polling frequency and type of devices. The OpManager Enterprise Edition can monitor up to 50,000 interfaces. To know the exact number of interfaces monitored by your OpManager installation, refer to the “edition” page on the product page.
What are the different types of Personality Identifiable Information in OpManager?
- Email ID
- Name
- Phone Number
- Mac Address
- IP Address
What are the supported datatypes for Performance monitors in OpManager?
The following data types are supported for Performance monitors in OpManager:
- Integer
- Decimal
- String
Why is intermediate/root certificate required when I import the certificate?
The intermediate and root certificates are needed to validate the server certificate provided. The server Certificate along with the intermediate and root certificates forms a complete chain, termed as ‘Chain of trust’, which establishes the authenticity of the certificate.
How do I install OPManager Plus
Being the Swiss Partner of ManageEngine, Kidan is responsible for aiding with professional services, such as installing, implementing, configuring, training, and supporting the company to ensure an effective on-boarding of OP Manager Plus.
To make it even better, Kidan even provides advice on top of it all!
Get in touch with us to know more.
Want to continue the conversation?
Thank you for the interest in ManageEngine's OP Manager solutions. Please fill out the form below to ask a question or request assistance.
Let us Know Your Requirements and Get an Exclusive Offer!
How We May Help You ?
Customer Service & Support
We value and believe in the relationships we have with our customers as they represent the most crucial part of our organization.
Kidan provides customer service and support via email. To contact our support teams, please feel free to send us an email to the below addresses:
A telephone hotline is available to our customers to receive immediate support and advise during business hours and days :
Telephone: +41 58 598 60 40
Business days: Monday – Friday
Business hours: 8:00 AM – 5:00 PM (Swiss time)
We also provide a live chat to ensure you get a quick response. You can reach us through our live chat widget on the bottom right of your screen. The availability of our chat support is:
- Monday – Friday
- 8:00 AM to 5:00 PM Swiss Time
FAQ's
Frequently Asked Questions
How does OpManager monitor the devices?
OpManager is an agent-less monitoring and management tool that uses a wide variety of protocols and technologies: ICMP, SNMP, WMI, CLI (Telnet/ SSH), TFTP, SCP. OpManager also includes a Syslog demon, SNMP Trap listener and Flow collectors for NetFlow, sFlow etc. All these and more bring together many network performance monitoring and management capabilities within OpManager.
How many devices can I monitor with OpManager?
The OpManager polling engine can monitor up to 10,000 Interfaces. However, this depends on the system hardware, polling frequency and type of devices. The OpManager Enterprise Edition can monitor up to 50,000 interfaces. To know the exact number of interfaces monitored by your OpManager installation, refer to the “edition” page on the product page.
What are the different types of Personality Identifiable Information in OpManager?
- Email ID
- Name
- Phone Number
- Mac Address
- IP Address
What are the supported datatypes for Performance monitors in OpManager?
The following data types are supported for Performance monitors in OpManager:
- Integer
- Decimal
- String
Why is intermediate/root certificate required when I import the certificate?
The intermediate and root certificates are needed to validate the server certificate provided. The server Certificate along with the intermediate and root certificates forms a complete chain, termed as ‘Chain of trust’, which establishes the authenticity of the certificate.
How do I install OPManager Plus
Being the Swiss Partner of ManageEngine, Kidan is responsible for aiding with professional services, such as installing, implementing, configuring, training, and supporting the company to ensure an effective on-boarding of OP Manager Plus.
To make it even better, Kidan even provides advice on top of it all!
Get in touch with us to know more.
Want to continue the conversation?
Thank you for the interest in ManageEngine's OP Manager solutions. Please fill out the form below to ask a question or request assistance.